
The Science of Guitar Tone: How Data Reveals the Difference Between Sounds
Can a Computer Hear the Difference Between Guitar Tones?
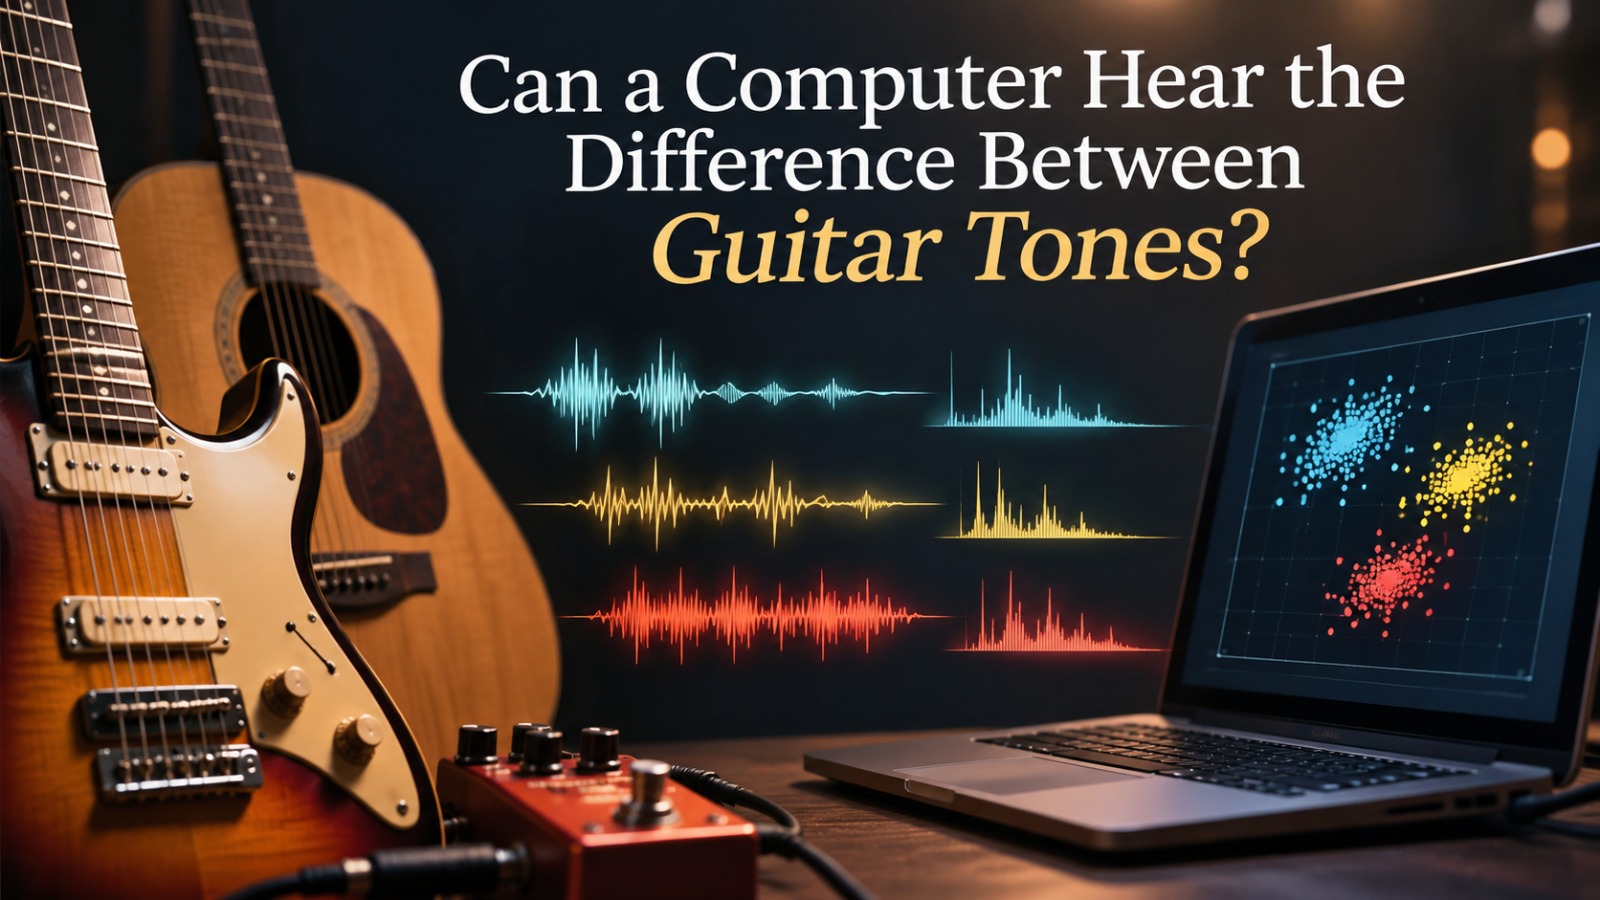
Usually, guitarists are able to describe a tone. The most commonly used adjectives include bright, woolly, or fizzy, but the more difficult question is if those words actually match something measurable and if a machine can identify and describe sounds like musicians can. This post outlines a study that tried to answer these questions by analyzing the frequency content of each sound.
Research question
Can machine learning distinguish guitar tones based on their frequency characteristics?
Why this is worth testing
Other researchers have been working on this similar question of this topic. An example is that Hulme and colleagues trained convolutional neural networks on log mel spectrograms and chromagrams in order to categorize different guitar tunings. For 2 tuning classes, the classification of accuracy was about 97.5% and for 5 tuning classes, the accuracy was roughly around 73.9%. These numbers are higher than what it normally would be because synthetic data is used, with consistent variations, so these accuracy numbers can act as a baseline than a direct comparison. Next, Ou and colleagues at University Of Rochester found that guitar technique recognition is achievable and can be promising for music areas such as music education, transcription, and performance analysis applications. This study also uses a dataset that Mitsou and colleagues released for electric guitar playing technique recognition.
Compared to technique or tune, tone is somewhat different because it is about how a sound feels to a listener. Sutar and colleagues took a data-driven approach to further our understanding of such adjectives in the context of guitar tone. Their paper is about how players talk about tone to the measurements, which is what this study will produce.
Study design
Notes. Every setup gets the same notes: the open strings and the fifth fret on each string. The pitch needs to stay fixed because higher notes naturally sound brighter. If there are pitch variations, it can potentially be mistaken for a tone difference.
Conditions. Three groups of sound are planned: acoustic, electric, and distorted electric. For the acoustic sound, a steel-string guitar will be used and it will be played with both, a pick and fingers. Then, for the electric guitar, one guitar will be used with the neck pickup and then the bridge pickup, and these two will be recorded separately. Lastly, for the distorted electric, that same guitar will run through an overdrive pedal and a fuzz pedal.
Recording. Every take will use the same interface, microphone position, and input gain, at 44.1 kHz and 24 bits. Each note will get several takes across multiple different sessions. Session separation is important in order for the evaluation to be fair, as explained below.
From sound to features
A waveform is hard to compare by eye, so the analysis moves into the frequency domain using a Fast Fourier Transform. From each note I will extract the following features:
- Spectral centroid, which is the center of mass of the spectrum and an estimate measure of brightness.
- Spectral rolloff, which is the frequency below which most of the energy sits.
- Spectral flatness, which indicates how noisy a sound is compared to a clearly tonal one. If the sound is distorted, this number should increase.
- MFCCs, which is a compact summary of spectral shape that shows up often in audio classification.
I plan to compute these with librosa. McFee and colleagues originally described it as a Python package for audio and music signal processing, and the project has continued to release versions since. A 0.10 release candidate is archived on Zenodo, which makes it easy to cite the exact version used.
Why distortion should stand out
There is also a physical reason to expect distortion to stand out. Clipping can add certain harmonics that the string never actually produced, and the balance between odd and even harmonics depends on the circuit. A study by Inui and colleagues found that intensity of even order harmonics differs depending on the power supply voltage in one analog distortion design. This is why two pedals can sound similar to the ear but at the same time have different fingerprints in the spectrum.
Clustering: do the tones group on their own?
For this study, k-means clustering on standardized features will be used instead of direct labels to test if sounds form a natural group without being told what they are. Thus, standardizing matters because a feature measured in hertz would have a different result and potentially overwhelm a feature used between one and zero.
In order to choose the amount of clusters, I will compare silhouette scores across a range of values. A two-dimensional projection from principal component analysis will let me plot the groups and see whether they line up with acoustic, clean, and distorted sounds. If they do, the features are carrying the information I expected.
Classification: can a model learn the labels?
Clustering shows structure. A supervised classifier tests whether that structure predicts which setup produced each sound. I plan to compare logistic regression against a random forest, both built in scikit-learn. The simple model acts as a baseline. If a complicated model barely beats it, the extra complexity is not earning its place.
The evaluation has one rule. Takes of the same note from the same session sound nearly identical, so if they end up in both training and test sets, the model looks better than it is. I will split by session, sending every take from one session entirely to training or entirely to testing.
What could go wrong
- Pitch confounding. Centroid climbs with pitch, so I will check results note by note.
- Setup drift. A microphone moved a few centimeters can change a spectrum more than a pickup swap does. I will log the setup for each session.
- Small samples. A few dozen takes per condition should reveal large differences, but two similar pickups may never separate.
- Clusters and predictions differ. Clean groups in a plot do not guarantee accuracy on new recordings.
What counts as an answer
The study succeeds if a model trained on some sessions identifies the correct condition in sessions it never saw, at accuracy clearly above chance. I will report a confusion matrix alongside the accuracy so the mistakes are visible. My guess is that acoustic and clean electric tones will be easy to separate, while the two pickup positions will be harder, since they differ mostly in high frequencies. That guess could be wrong, and the results will show it.
Where this stands
This post covers the design. The recordings and analysis are still ahead, so no accuracy numbers appear yet. Once the sessions are finished, the results section will include the clustering plots, the cross-validated scores, the confusion matrix, and the features the model relied on most.
References
- Hulme, E., Marshall, D., Sidorov, K., & Jones, A. (2024). Acoustic classification of guitar tunings with deep learning. Proceedings of the 11th International Conference on Digital Libraries for Musicology (DLfM 2024), ACM, pp. 6-14.
- Mitsou, A., Petrogianni, A., Vakalaki, E. A., Nikou, C., Psallidas, T., & Giannakopoulos, T. (2024). A multimodal dataset for electric guitar playing technique recognition. Data in Brief, 52, 109842.
- Ou, Z., Tian, X., & Yuan, J. (2025). Machine learning-based classification of guitar playing techniques [Final report]. University of Rochester, ECE 408.
- Sutar, P., Naradowsky, J., & Miyao, Y. (2024). Does it chug? Towards a data-driven understanding of guitar tone description. Proceedings of the 3rd Workshop on NLP for Music and Audio (NLP4MusA 2024).
- Inui, M., Hamasaki, T., & van der Veen, M. (2021). Intermodulation distortion analysis of a guitar distortion pedal with a starving circuit. Journal of the Audio Engineering Society, 69(1/2), 80-103.
- McFee, B., Raffel, C., Liang, D., Ellis, D. P. W., McVicar, M., Battenberg, E., & Nieto, O. (2015). librosa: Audio and music signal analysis in Python. Proceedings of the 14th Python in Science Conference (SciPy 2015), pp. 18-25.