
The 54% Ceiling: Why Enterprise AI Needs Three Graphs, Not One
Enterprise AI stops working at 54% accuracy.
That is the ceiling dbt Labs researchers hit when they bolted a knowledge graph onto GPT-4 and pointed it at production questions. Raw SQL access sat at 16.7%. A governed semantic layer on top pushed Snowflake Cortex to 100% on its benchmark. The lesson buried in those numbers is structural, not statistical.
You do not have a model problem. You have a graph problem.
The Three Layers Nobody Separates
Most enterprise AI teams treat "context" as a single deliverable. A knowledge graph. A RAG pipeline. A semantic layer. Pick one, ship it, move on.
That is why the agents fail.
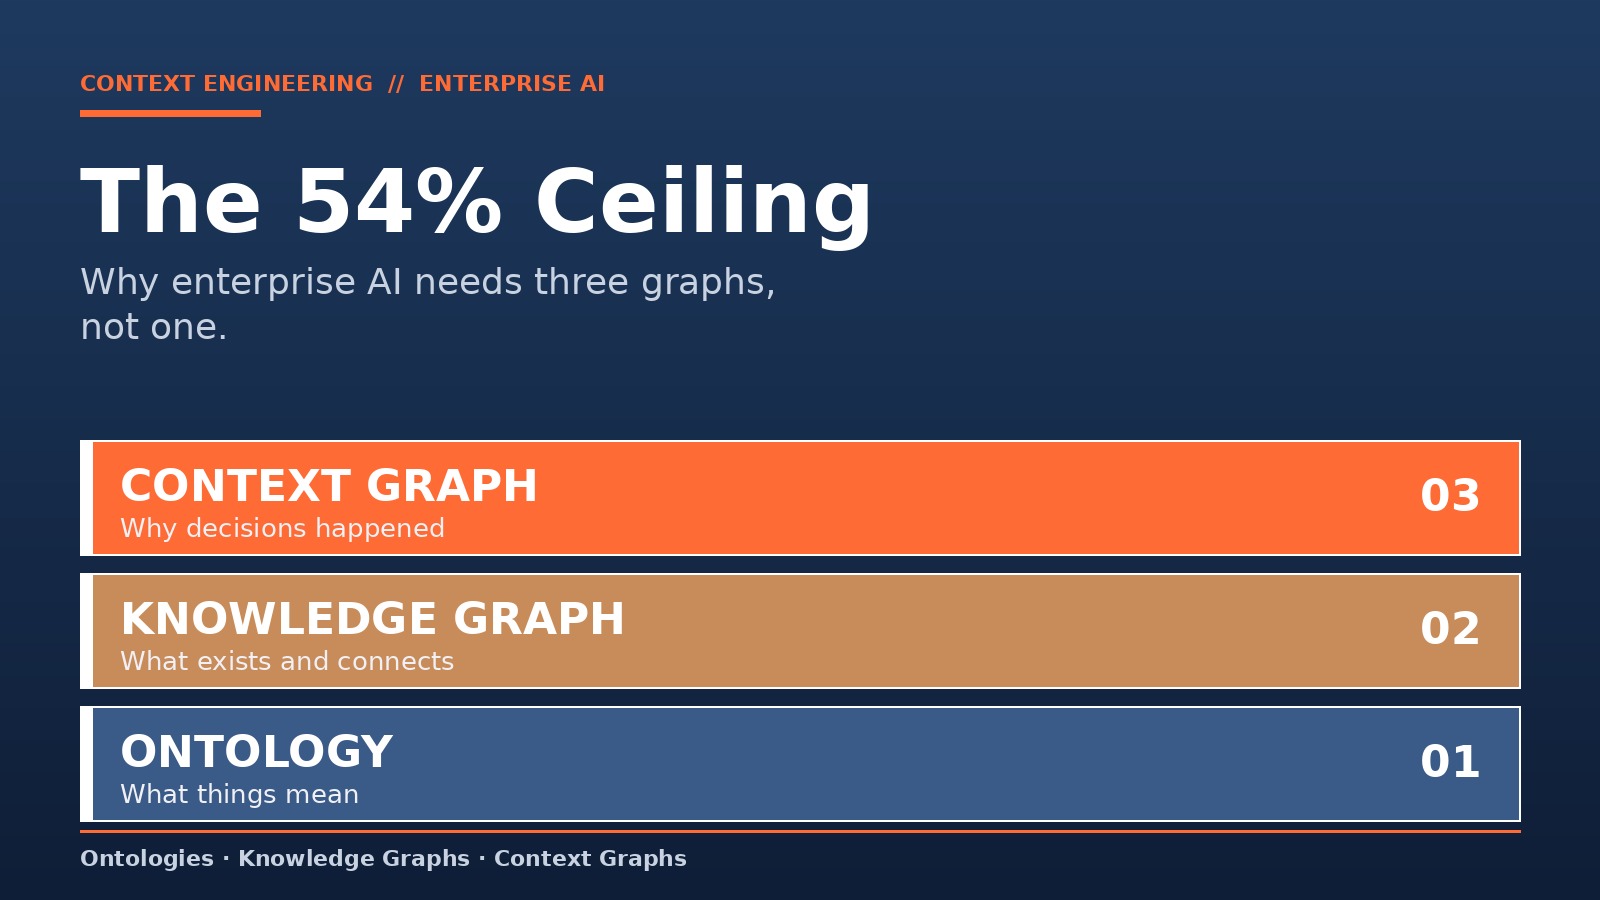
Context for enterprise AI is three distinct layers, and each answers a different question:
- Ontology answers what things mean. It is the vocabulary. A "customer" at your company is not a "customer" at the next one over.
- Knowledge Graph answers what exists and how it connects. Engineer A owns Ticket B. Project X depends on Service Y. Static relationships, queryable facts.
- Context Graph answers why a decision was made, by whom, under what policy, and when. Discount Request #1234 approved because Customer Tier 1 plus Q4 Revenue Target plus VP Override on November 14, 2025.
Strip out any one layer and the stack collapses.
What Each Layer Catches That The Others Miss
The ontology layer catches vocabulary drift. Your CRM says "account." Your billing system says "customer." Your support tool says "organization." Without an ontology, the agent retrieves three disconnected records and hallucinates a fourth. With an ontology, those three terms resolve to one entity.
The knowledge graph catches multi-hop reasoning. Ask a vector database which customers opened tickets related to the feature that Team Delta shipped last quarter, and it returns document snippets. Ask a knowledge graph the same question and it traverses Team → Ships → Feature → Referenced-In → Tickets → Opened-By → Customers. Four hops, one answer.
The context graph catches the reasoning behind the answer. Knowledge graphs tell you Dataset X is governed by Retention Policy Y. Context graphs tell you that the exception allowing the ML pipeline to use behavioral data was approved by the Data Governance Board on a specific date, valid for six months, conditional on anonymization. That is not metadata. That is an audit trail the agent can traverse during execution.
The Numbers That Should End The Debate
- Raw SQL query accuracy on enterprise questions: 16.7%
- Adding knowledge graph representation: 54.2%
- Adding a governed semantic layer on top: up to 100%
- Fortune 500 annual loss from poor information sharing: $31.5 billion
- Enterprises with mature agent governance frameworks: 21%
- Enterprise data that remains unanalyzed: 68%
Read those top to bottom. Each jump is a layer. The 37-point leap from SQL to knowledge graph is relationship context. The leap from knowledge graph to semantic layer is vocabulary context. The missing leap, the one most vendors will not sell you yet, is decision context.
Why Teams Keep Building The Wrong Graph
The failure mode is predictable. A team reads a GraphRAG paper, spins up Neo4j, ingests documents, and calls the project done. Six months later the agents cannot answer "why did we approve this" because the graph has no concept of approval. It has entities and edges. It has no decisions.
Context graphs were never in the original spec.
Four failure patterns show up across enterprise deployments:
- The Ontology Shortcut. Teams skip vocabulary alignment and let the LLM guess. Guesses compound across hops.
- The Static Graph. Teams build a knowledge graph in week one and leave the schema untouched. Six months in, half the entities are stale.
- The Log-As-Graph Fallacy. Teams store decision traces in application logs and assume an agent can reason over them. Logs are not traversable.
- The Single-Graph Monolith. Teams cram ontology, relationships, and decisions into one graph and end up with a structure that serves none of the three needs well.
The Architecture That Works
The enterprises hitting 90-plus percent agent accuracy share a pattern. Three graphs, layered, each with distinct governance.
- Start with the ontology. A minimal viable ontology covers the ten entities every team argues about. Customer. Account. Project. Ticket. Employee. Policy. Document. Product. Team. Incident. Define them once, in one place, with one authority.
- Build the knowledge graph second. Model the relationships that matter for retrieval. Who owns what. What depends on what. What references what. Keep the schema editable.
- Layer the context graph on top. Capture decision traces with temporal validity, approval authority, and policy references as first-class graph nodes. Not as comments. Not as log entries. As queryable paths.
- Wire all three into retrieval. The agent queries the context graph first (what was decided), the knowledge graph second (what exists), and the ontology last (what these words mean). Three lookups, one grounded answer.
The Governance Consequence
Only 21% of enterprises have mature agent governance frameworks, according to Deloitte's 2026 State of AI report. That number looks like a training gap. It is not. It is an architecture gap.
You cannot govern an agent whose reasoning path is invisible. Context graphs make the path queryable. When an auditor asks which policy an agent applied to approve a transaction, the answer is a graph traversal: Transaction → Approved-Under → PolicyV3 → Authored-By → ComplianceOfficer → Effective-From → 2025-Q3. The governance lives inside the graph, not next to it in a PDF nobody reads.
This is the structural difference that separates theatrical AI governance from operational AI governance.
The Closing Math
Enterprise AI is not failing because the models are weak.
It is failing because the context architecture underneath them is one-dimensional. Vendors keep selling a single graph as a complete solution, and teams keep deploying it as one. The 54% ceiling is not a model limit. It is a graph count.
The fix is not a better model. It is three graphs.